XRP Price Prediction as XRP Pumps 4% – How High Can it Go?
XRP, the cryptocurrency that underpins Ripple’s global blockchain-based payments system, was last trading lower by just over 1.0% on Friday, having pulled back from weekly highs in the $0.3950 area to trade around the $0.3900 level. That still leaves the cryptocurrency higher by about 4.2% versus earlier weekly lows.
US PPI data was recently released and, while confirming a further decline in the YoY rate of inflation, the decline wasn’t as big as expected, and has thus weighed on sentiment in cryptocurrency markets a touch. Thus, XRP price predictions haven't gotten that much more bullish.
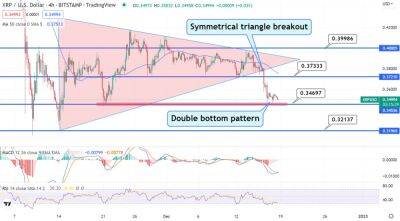
XRP’s rally in the last few days from recent lows doesn’t signal a sudden resurgence in XRP risk appetite. The cryptocurrency has only been able to recover back to close to its 21 and 200-Day Moving Averages again and remains well within recent ranges. XRP has also failed to get back to the north of a key Fibonacci level that marks the 61.8% retracement back from September highs in the $0.56 area to June’s annual lows in the $0.28 area.
In the last few weeks, XRP appears to have formed a descending triangle pattern, with support keeping a floor under the price action in the low $0.37s, while the upside has been squeezed by a downtrend that began on the 25th of November. Descending triangles tend to form ahead of a bearish breakout. The XRP bears will thus be biding their time and waiting patiently for XRP to break lower once again towards sub-$0.35 levels.
XRP appears to be at a crossroads. It looks to be around the middle of both short ($0.37-42) and longer-term ($0.31-55) ranges. The $0.42 area is a formidable area of resistance – it has consistently acted as both resistance and support since late July and is where the 100 and 50DMAs
Read more on cryptonews.com
