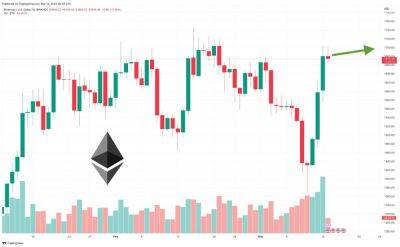
Will Ethereum Classic repeat recent history and recover from $18 level soon
Disclaimer: The information presented does not constitute financial, investment, trading, or other types of advice and is solely the writer’s opinion
Ethereum Classic saw a large rally from $15 on 3 January and reached $23.9 on 14 January. The rally of Bitcoin was on 8 January, after it burst out past the $17k resistance. Bitcoin’s rally was slower and a bit later than ETC’s.
ReadEthereum Classic’s [ETC] Price Prediction 2023-24
Just like the gains were delayed, it seemed that the losses and shift in trend were apparent in Ethereum Classic earlier than for Bitcoin. While BTC rested at $22.3k, ETC fell beneath its six-week range.
At the time of writing, the next move on the ETC chart was unclear, but a bounce toward $19.5 might not be surprising.
Source: ETC/USDT on TradingView
The implication made above was not that ETC leads BTC, but rather an observation that ETC happened to move before Bitcoin did. This might or might not repeat itself. Taking the charts of Ethereum Classic, we see that the bulls will not find much to be enthused about.
The price made a series of lower highs and lower lows since 24 February, which meant the trend was bearish. The RSI stood at 28 to show oversold conditions on the 4-hour chart, but this did not indicate a reversal.
However, the CMF climbed above +0.05 to show significant capital inflow into the market.
Thrice in the three months of November, December, and January, a test of the $18 level of support saw a notable bullish reaction.
Could March be the fourth such instance? It remained to be seen. In either case, shorting Ethereum Classic around the $18 mark was not feasible in terms of risk-to-reward.
Is your portfolio green? Check the Ethereum Classic Profit Calculator
In November and December, the
Read more on ambcrypto.com


![Tron [TRX] finds impetus thanks to stablecoin transfers in this way - ambcrypto.com](https://gocryptonft.com/storage/thumbs_400/img/2023/3/14/91078_tuk.jpg)
![Ethereum [ETH] likely to face a wall of sellers at $1700 – Can the bulls prevail? - ambcrypto.com](https://gocryptonft.com/storage/thumbs_400/img/2023/3/14/91069_jhv.jpg)


![USDC, SVB saga fuels massive profits for Ethereum [ETH] as Shanghai looms - ambcrypto.com - city Shanghai - city Santimentat](https://gocryptonft.com/storage/thumbs_400/img/2023/3/13/90979_bfj8.jpg)

