Binance Coin shows strong bullish momentum, but buyers can wait for…
Disclaimer: The information presented does not constitute financial, investment, trading, or other types of advice and is solely the writer’s opinion.
There was some fear around Binance Coin in recent days. The order from the New York regulator to Paxos to stop minting BUSD tokens was accompanied by a plunge in BNB prices on 13 February.
Read Binance Coin’s Price Prediction 2023-24
Since then, Binance Coin was able to push itself back above $300. Bitcoin was also bullish and noted large gains over the past couple of hours, which helped sway market sentiment in favor of the buyers.
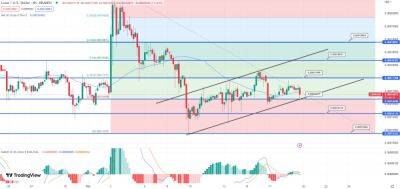
Source: BNB/USDT on TradingView
On the 4-hour chart, Binance Coin had been firmly bearish until very recently. This was because of its failure to hold on to $320 as support a week ago. Back then, an ascending triangle pattern (orange) was spotted after a steady uptrend for Binance Coin.
The inference was that a breakout above $330 could propel BNB to $360. However, the selling pressure ramped up and prices crashed from $320 to $290 in the span of five days. The drop below $320 showed the market structure flip to bearish.
Is your portfolio green? Check the Binance Coin Profit Calculator
The recovery since that drop broke that bearish structure. The lower high at $320 was defeated, and it was likely that BNB will set a higher low and continue upward. But where will this higher low be? On the 4-hour chart, a large imbalance was spotted and marked in white.
This FVG is likely to be filled over the next day or two. The $300-$315 area has been strong support since 21 January, and another move upward could commence after a retest of this zone.
More ideally, buyers would want to see a revisit to the bullish order block at $288-$294 to buy BNB, with a stop-loss
Read more on ambcrypto.com







![Binance USD [BUSD] maintains its peg even as outflow increases - ambcrypto.com](https://gocryptonft.com/storage/thumbs_400/img/2023/2/18/88957_q9t.jpg)
